


Can you answer the following questions about your website?
- How many different visitors does your website get over a given period of time, be it a day, week or month?
- How do people find your website? Through search engines? Through links from social media posts? Or is it some other way?
- When people get to your website, how much time do they spend there?
- What pages on your website get the most traffic?
- What percentage of visitors view your website on a desktop or laptop computer and how many do so using a smartphone or other mobile device?
You can answer these and many other questions quickly and easily using a tool that, if you are one of our clients, is already installed on your website. That tool is Google Analytics.
The best of the best?
While there are many tools available for tracking website traffic, it’s tough to beat Google Analytics when it comes to features and accuracy. And, best of all, it’s essentially free.
Okay, Google does offer a paid version of Analytics. However, most businesses will never come close to using all the features included in the free version. If fact, you’d most likely have to be a big corporation to need the additional features available in the paid version.
Many of our clients already take advantage of the wealth of information Google Analytics offers. If you are not among them, perhaps you should be. Let’s take a look at some of the things you may be missing.
Commonly viewed Analytics features
Here are some of the things you will see when you first access your Analytics page. If you are viewing this on a desktop or laptop, clicking on an image will show you an enlarged version of it.
The first image shows the traffic graph. This particular graph covers the preceding 28 days but it could be for any time you specify.
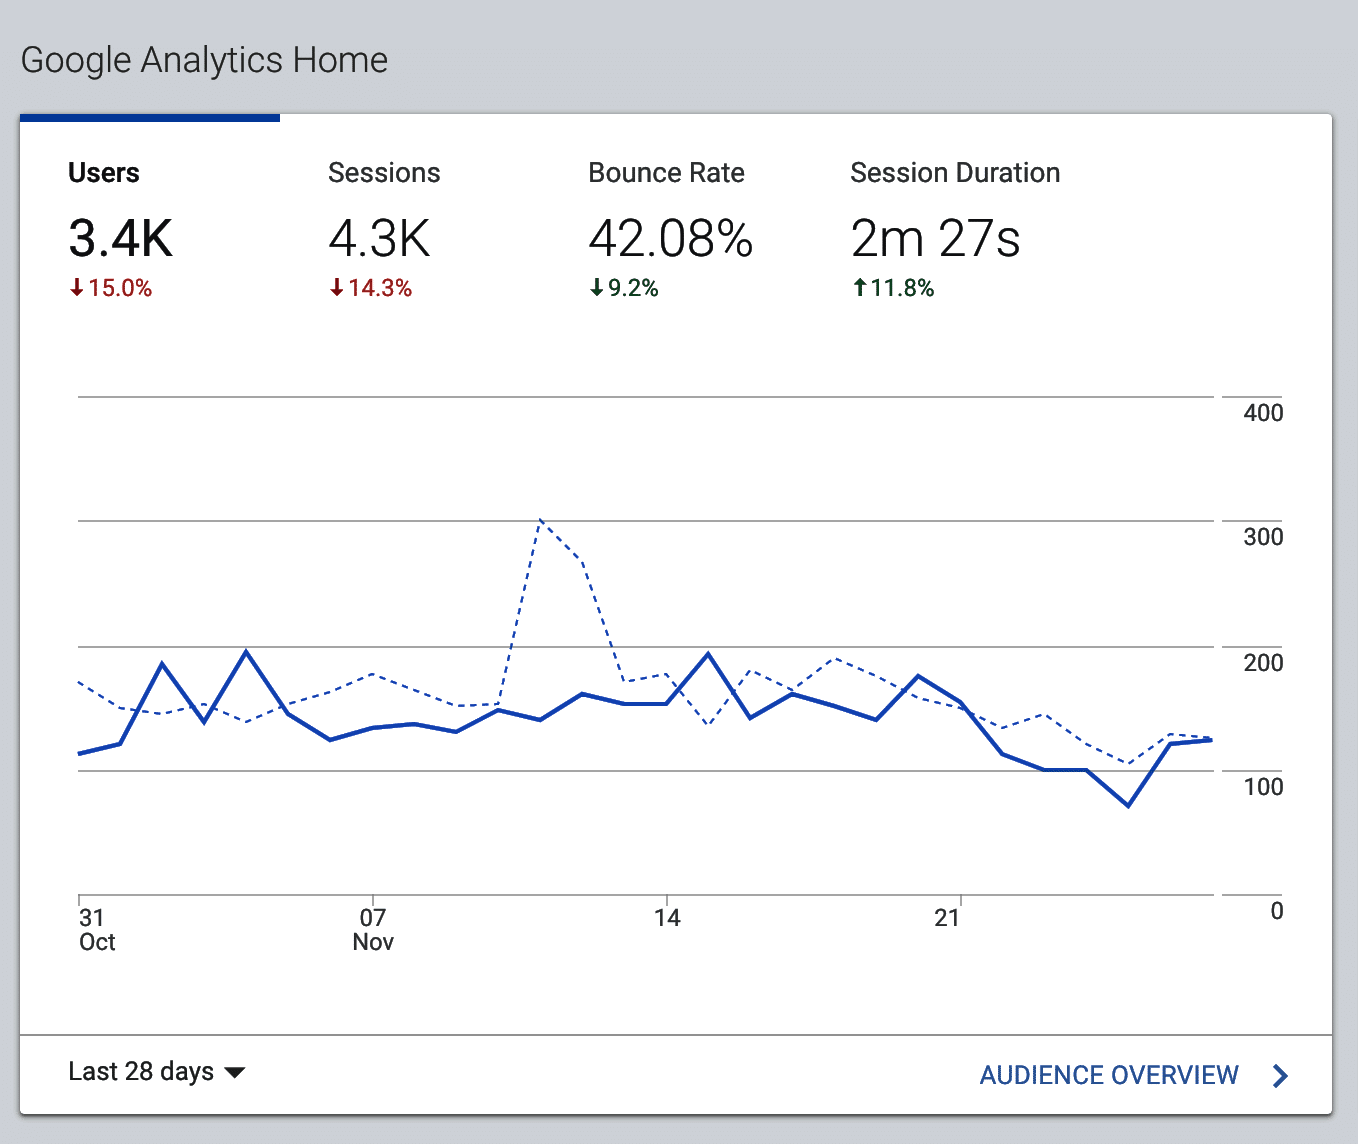
- Users refers to the number of unique individuals who visit the site during the specified time period.
- Sessions refers to the number of unique visits during the same time period. This is higher than the number of users because of repeat visitors.
- Bounce rate refers to the percentage of visitors who arrive at your home page or other landing page and then take no further action, either because your home page told them everything they needed…or because there was no obvious link to the information they were hoping to find. A certain number of bounces is inevitable. More than this, however, is not good.
- Session duration refers to how long, on average, visitors stay on your website before leaving. The longer, the better. If it is less than a minute, you have a problem that needs fixing.
The next graphic shows the sources of your website traffic.
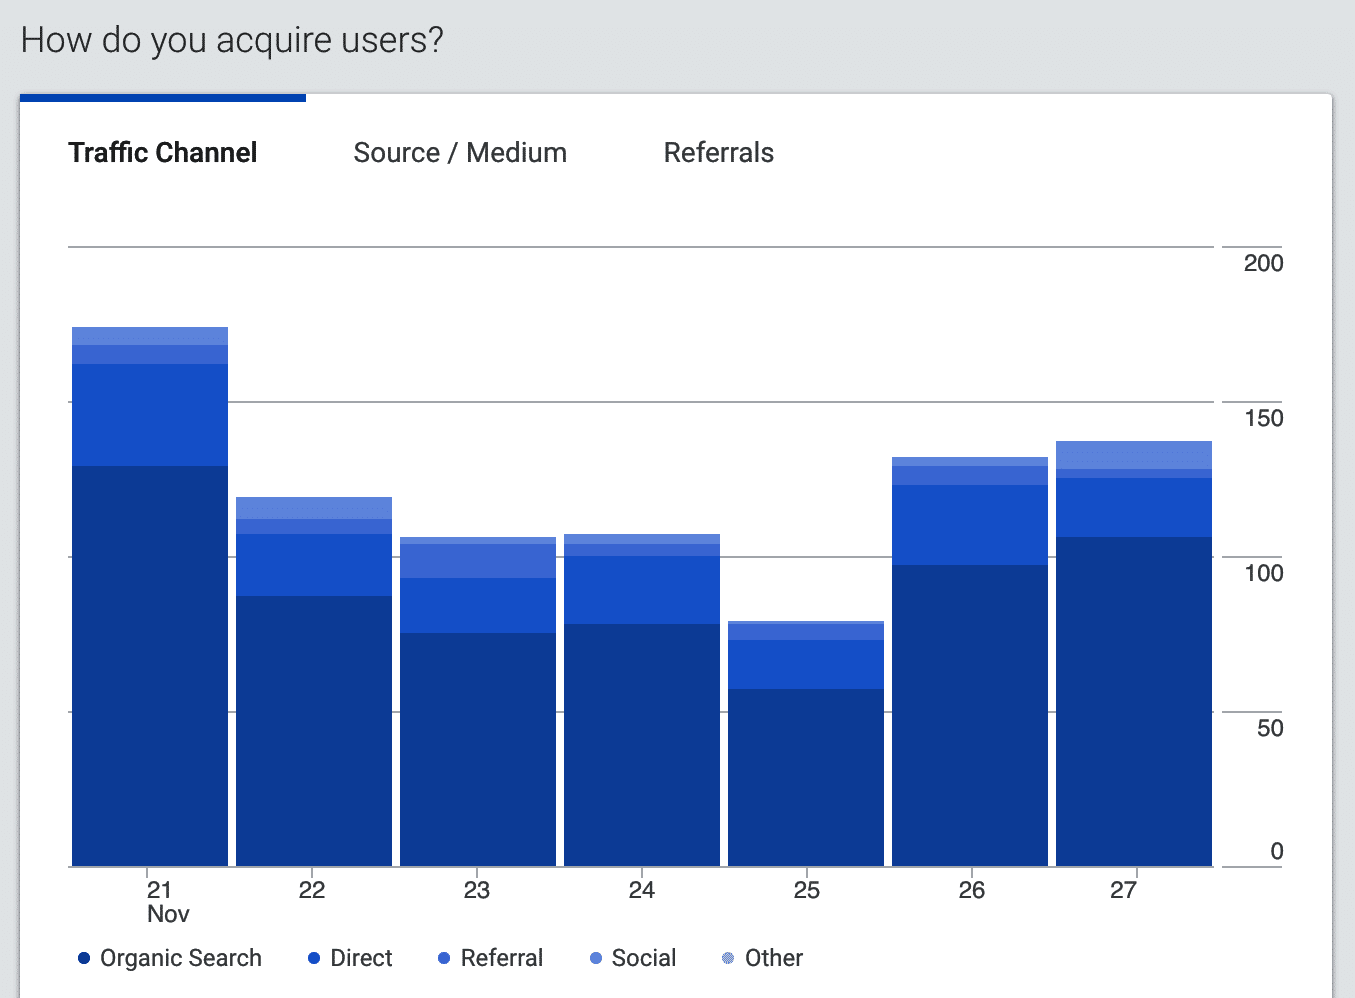
- Organic search refers to visitors who find your website by using Google, Bing or another search engine.
- Direct refers to visits by people who typed your URL into their browser’s address bar or have it bookmarked.
- Referral refers to visitors who clicked on a link on another website to find you.
- Social refers to traffic generated by links posted on Facebook or other social media.
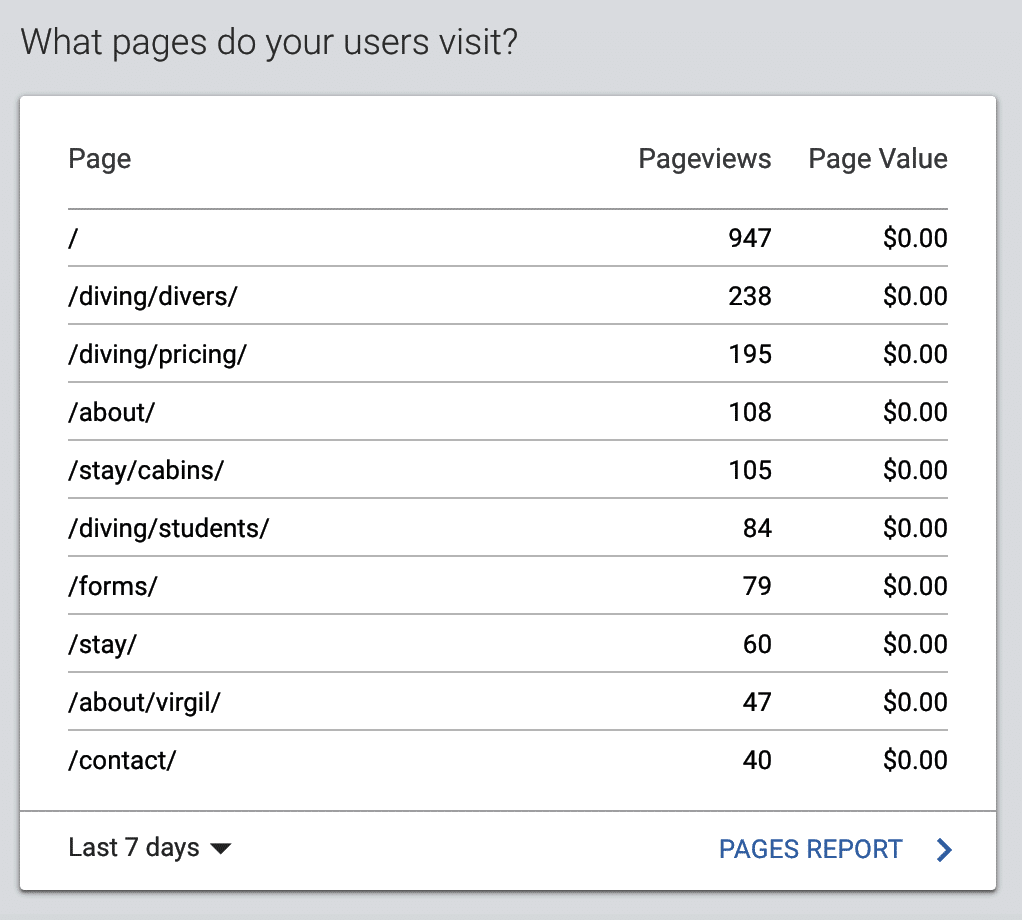
Next, we come to pages. This is pretty much what you would expect. It allows you to see which pages generate the most traffic and how they compare to other pages.
The final graphic shows two things:
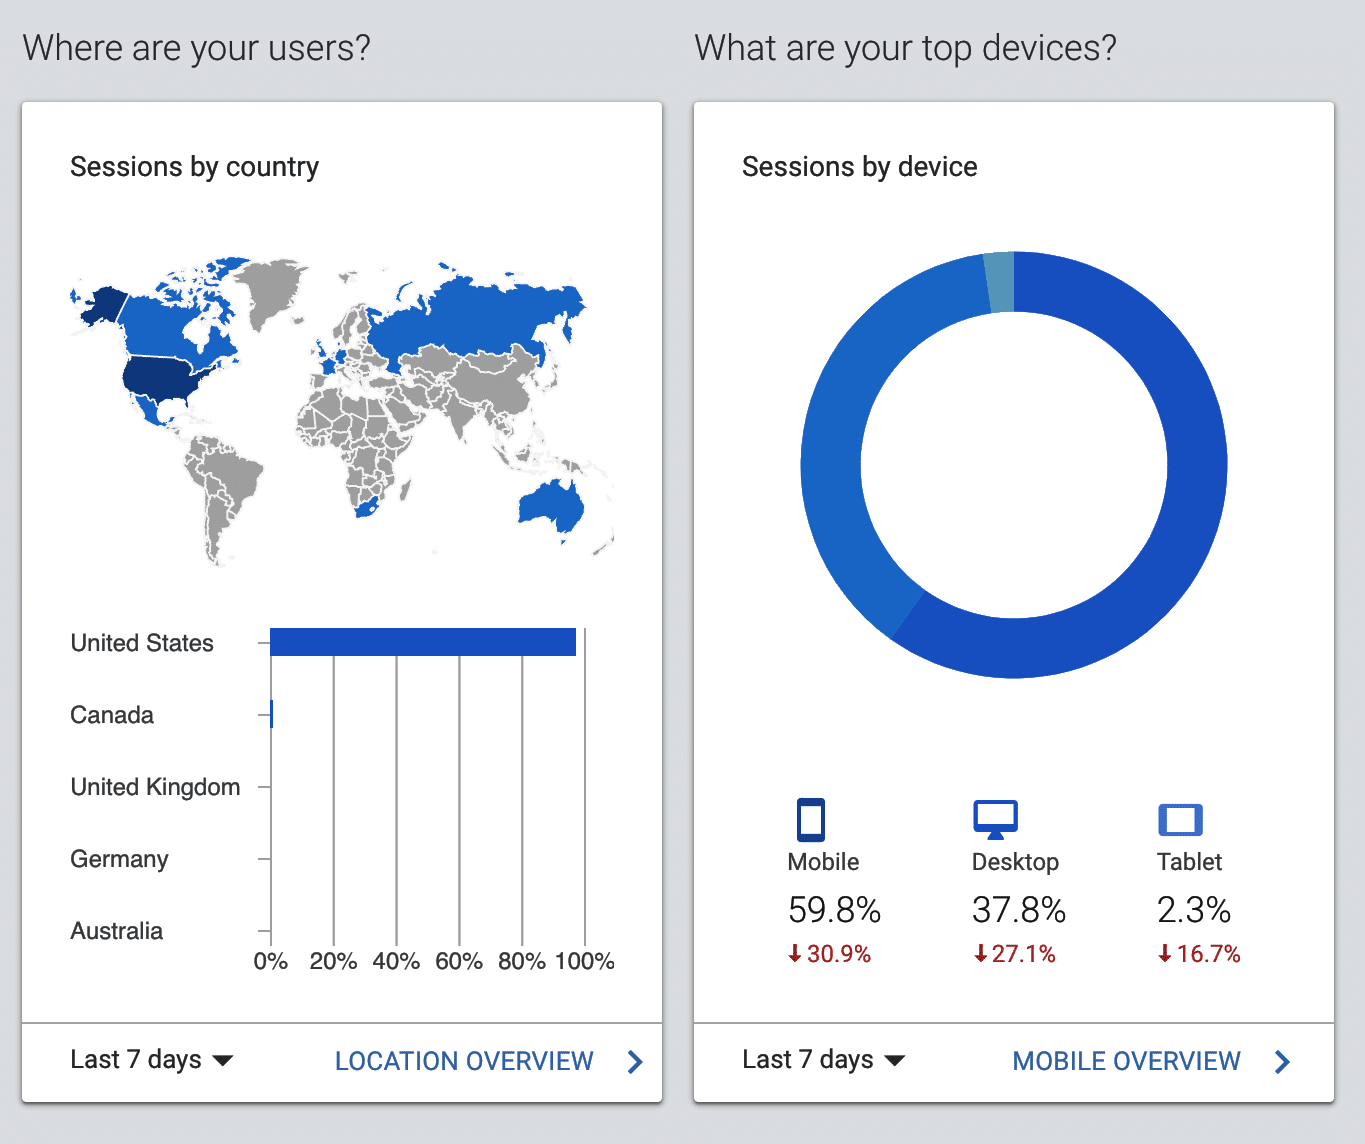
- Sessions by country will tell you who your international visitors are. This surprises a lot of people.
- Sessions by device underscores a very important point. That is, 60 percent or more of your visitors will view your website using their smartphone. It’s vital your website be every bit as usable on a phone as it is on a desktop or laptop.
Bear in mind, these graphics just scratch the surface of the wealth of information Google Analytics can provide. You can’t fully appreciate this until you get on Analytics and start exploring for yourself.
Analytics in action
Having data is one thing. It is of little value, however, unless you can use it. Here is how we most often use Google Analytics to fine-tune our clients’ marketing efforts.
- Your website won’t generate traffic by itself. Search Engine Optimization (SEO) can help; however, to get traffic to your website, you must drive it there yourself.
- Most of our clients do this through a combination of email newsletters, social media posts and content marketing.
- Whenever one of our clients does this (or we do so on their behalf), we use Google Analytics to see how effective it was.
- Invariably, we see a spike in website traffic that corresponds to the newsletter or social media post in question. We’re most interested in how big a spike this is.
- If the goal was to drive traffic to a specific page, we use Analytics to see if that page got the traffic we wanted.
Inevitably, some of these efforts perform better than others. By learning from past experience, both we and our clients are able to fine-tune our marketing messages for maximum results.
Another common use for Analytics is to improve Google AdSense performance. One of our clients completes in a field with dozens of competitors. AdSense helps him stand out among the crowd. Analytics helps him do so more effectively.
Use it, don’t lose it
As you can see, Google Analytics is a powerful tool you should be taking advantage of.
- If you are one of our website clients, we already have Analytics installed on your website. Let us know and we will make sure you have access to the data.
- If you are not one of our clients you can set up an Analytics account on your own or get your web consultant to help you.
Either way, it’s too good an opportunity to miss.